Getting started
Diagnostic Efficiency
Load the package de. The calculation of the diagnostic efficiency can be easily demonstrated on the provided example dataset.
In [1]: from pathlib import Path  # OS-independent path handling

In [2]: from de import de

In [3]: from de import util

# path to example data
In [4]: path = Path('./data/13331500_94_model_output.txt')

# import observed time series
In [5]: df_ts = util.import_camels_obs_sim(path)

# make numpy arrays
In [6]: obs_arr = df_ts['Qobs'].values

In [7]: sim_arr = df_ts['Qsim'].values

# calculate the diagnostic efficiency
In [8]: de.calc_de(obs_arr, sim_arr)
Out[8]: 0.31952943574731846
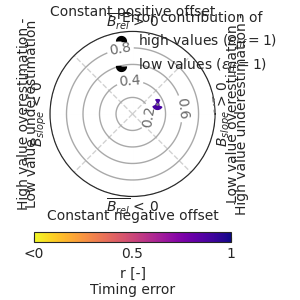
Diagnostic polar plot
In [9]: from pathlib import Path  # OS-independent path handling

In [10]: from de import de

In [11]: from de import util

# path to example data
In [12]: path = Path('./data/13331500_94_model_output.txt')

# import observed time series
In [13]: df_ts = util.import_camels_obs_sim(path)

# make numpy arrays
In [14]: obs_arr = df_ts['Qobs'].values

In [15]: sim_arr = df_ts['Qsim'].values

# display diagnostic polar plots
In [16]: de.diag_polar_plot(obs_arr, sim_arr)
Out[16]: <Figure size 300x300 with 2 Axes>